
Listen to the music

Or how learning some Python to deep dive into data made me like less of a waste of space
By Alana
It was my birthday last weekend. Like most birthdays in my mid-thirties, the day sent me spiraling.
What have I done with my life? Why don’t I have a real job? Or a house and salary over 100k?
By conventional metrics, I’m falling short. I’m a data junkie — clickthroughs, time on site, and impact were staple reporting requests in my old day job. Results were requisite for my paycheque.
I left that world of marketing and comms nearly three years ago, but that “so what, who cares” mindset (a common refrain from my then-boss) appears hardwired. Today, I’m still compulsively quantifying life: kilometers run, classes taught, books read. Doesn’t matter. If it’s logged somewhere, I want it in a spreadsheet, colour-coded and timestamped.
But what KPIs do you use to justify your existence? Who watches that riveting presentation anyway? And why do I feel this compulsion to prove my worth via data? As my friend Emily says, “I didn’t ask to be born!”
Net worth. Impressive job titles. Letters after a name. Are these adulting benchmarks of yore even applicable for a generation that’s lived through multiple major market crashes, the “war on terror”, a global pandemic, an increasingly fiery planet, the ubiquitous dominance of the internet and its concomitant tech-supercorps, insurrection in the US, institutionally sanctioned genocide at home and abroad, wage stagnation, political polarization, and trade wars?
This litany of doom awaits every time I read the news. As I tried to define the KPIs of a life well-lived, it occurred to me that my obsession with data may be a response to “the heartache and the thousand shocks that flesh is heir to.” I know I’m never going to achieve the kind of stability my middle class parents did. So instead, I find meaning in the moments that make my heart feel full.
Feet on the trail. Places I've been and the memories made there. And, in this post, the songs that made me move, smile, cry, and more.
Learn a thing to feel less useless

Feeling like a real vibe coder now! Not sure I should be proud of that?
I love my day job at the University of Waterloo because it makes it so easy to learn stuff.
Every year, our talented library staff host Love Data Week. This year, I caught a presentation by a former yoga student of mine, Antonio, and his coworker that got me itching to dive into a facet of my data I hadn't explored.
Antonio and Anneliese’s talk, Make Your Own Spotify Wrapped, invited the audience to request their data from the music streaming giant. They commented on what makes good data and modelled the Jupyter Notebook tool to use Python scripts that mine the data for insights.
Companies like Spotify, who amass and employ user data in R&D and monetization, are legally obliged to make that data accessible if the user requests it. Here's how the process worked for me. I:
Visited Spotify’s account data page
Requested Extended Streaming Data
Stewed impatiently for about a week
Got an email – my data was ready for download!
Despaired because I had no idea what to do with the ten .json files I just downloaded
Rejoiced because I remembered that Antonio's awesome Jupyter Notebook walked me through converting those files into something usable
Realized that my very basic knowledge of programming wouldn't get me very far analyzing this data
Called my coder pals Kenny and Sagnik to help me set up Jupyter, Python, GitHub, etc, and said yes to installing so many extensions
Ran the Jupyter Notebook. Hiccups. Syntax errors. All my fault, not the notebook’s. Asked CoPilot (Microsoft’s AI assistant) for help. Fixed things. Felt like a pro.
Downloaded my data as a .csv file with ~155,000 rows, one for every song I listened to between February 1, 2016 and February 28, 2025.
And boom! I learned a bit of Python and, with the help of the Jupyter notebook, created some fun visualizations of my data. I even channeled my inner vibe coder and used CoPilot to modify Antonio's code to run more robust analyses.
Some insights:
Number of Songs Listened To and Total Listening Time Feb 1, 2016 - Feb 28, 2025

It’s no accident that my listening hours skyrocketed when I started teaching fitness - if I have 16 hours of classes in a week, that’s a guaranteed 16 hours of listening.
Top Artists Across Full Dataset

Lofi music = from teaching yoga. Gareth Coker = D&D playlists. No idea how so much Ed Sheeran got on there, nope, no clue at all, I am definitely not a basic b****.
Wordcloud of Most Frequent Words in Song Titles

Strangely, I cannot think of a single song with the word “Forest” in the title right now.
Data tells a story
Inspired by Antonio and Anneliese, I wondered what other patterns existed in my data. The spreadsheet’s columns included:
Song title and artist name
Album title
The exact date and time I listened
The number of milliseconds listened for each song
What device, browser, OS, and IP address I listened from
How I started and ended the listening experience for each song
What kind of stories could this data tell about nearly ten years of my life?
All year I've been testing the limits of what AI tools can do. This task – looking for patterns in 155k rows of data – seemed the perfect job for a machine. My brain can’t hold that volume of information in context, but with the help of Claude’s Sonnet 3.7 model and my software dev friend, I generated more code to analyze this info.
Shockingly, it worked! Here are some of the stories:
Most soundtracked day of the year
Claude helped me write code to identify my “highest listening minutes” day each year. Curious about these days, I checked Google Photos to see if I had visual evidence of what transpired to cause so much listening.

2016, Dec 25: Baking with my mum on Christmas day. (268 minutes)
2017, Dec 9: Took no photos this day. Checked Google Timeline. I went to the pharmacy? It was a Saturday? No idea why I listened so much. (470 minutes).
2018, Dec 10: Thanksgiving camping at Restoule Provincial Park outside of North Bay, ON. (499 minutes)
2019, Aug 27: A Tuesday. The only photo from this day I have is of my partner’s foot and one of his favourite YouTubers on our TV??? A mystery. (857 minutes)

2020, Dec 11: Lockdown life, stargazing roadtrip with a stop at the super lame Castle Kilbride. (641 minutes)
2021, Jul 27: Camping road trip, Bonnecherre area, Renfrew County ON (679 minutes)
2022, Jan 21: Slow bus ride on the 401 back from my mum’s after Chinese New Year. Saw some birds? (708 minutes)
2023, Jan 23: COCO! The best dog. Another weekend in Mississauga. (829 minutes)
2024, Sept 14: Incredible sunrise at the Waterloo airport. Picking up Shannon. Saturday teaching rocket and arts + crafting at home. (774 minutes)
Listening habits
Even at a smaller scale, patterns appeared. Apparently my peak listening time is midafternoon. Aka the time of day when my morning-person brain shuts down, and I need to blast something loud, sing along, and do tedious admin tasks for work.

Three in the afternoon Saturday was my most-listened time of the week across the dataset. This is often a blaring music and cleaning the house time of day.
Analysis didn’t reveal a huge variation in volume of listening to by day of the week, but at the season-level, winter stood out as the most musical. Guess all those days holed up inside painting to good playlists add up.

Stop skipping, Alana!
If you've ever been on a road trip with me, you know that it feels like I’m physically incapable of listening to a song all the way through. I blame the ADHD. It was neat to see that, despite the accusations of officemates and carpool pals, I don't skip songs that much. Just one out of every five. Not bad… right?

This data has depressing implications for artists on Spotify. The company doesn’t make it easy for artists to get paid; songs need to be played for at least thirty seconds before an artist receives a royalty. I skipped at the sub-30-second mark for about 28,000 of the 155,000 songs I listened to, meaning that all those artists received nothing for my listening time.
Turns out there are artists I am more likely to skip (Great Big Sea, The Lumineers) and others I'm more likely to listen to all the way through (Noah Kahan. I have no idea why?).

Do you actually discover new music on Spotify?
Do you like the “Made for You” playlists Spotify curates?
Spotify’s business strategy has evolved over the company’s nearly two decade lifespan. Where once the Spotify landing page was a source of human-curated playlists and a font of recommended tracks you’d probably enjoy, today their algorithm frustrates many.
At some point, the “discover” section lost coveted above-the-fold placement in favour of a “made for you” banner. This section serves us the same music we already listen to, packaged under pithy titles, with a new song or two thrown in. An eerie sameness of aesthetic emerges with enough listening.
Though I feel like I don’t find new music on Spotify these days, my data tells a different story. I analyzed the number of “songs discovered” – i.e., the appearance of a song for the first time in the data set – and tabulated how many new songs I discovered in each quarter.


My discovery of new-to-me music increased massively in November 2021. This correlates perfectly with when I started teaching free online yoga classes, preparing for the yoga teacher training I completed in winter 2022. From that point on, my listening data was infiltrated with ambient, instrumental, woo woo playlists and song titles.
Falling in love with a song
They say we’re most nostalgic for the music of our teen years, and while I do still enjoy a good shitty rock banger from the early 2000s, I wanted to know what my data said about my ability to embrace new music. When I heard a song for the first time, was I likely to keep listening to it, or would I abandon it for old stalwarts?
This was a harder question to answer and express. Of the songs listened to, I played:
16% of new songs again within one week of hearing the song for the first time
22% of new songs again within 1 month of hearing the song for the first time
32% of new songs again within 6 months of hearing the song for the first time
39% of songs again within 1 year of hearing the song of hearing the song for the first time
Four out of every ten new-to-me songs were keepers, meaning six out of every ten were songs I’d listen to once, probably skip, and never seek out again.
Some other fun visualizations from my data
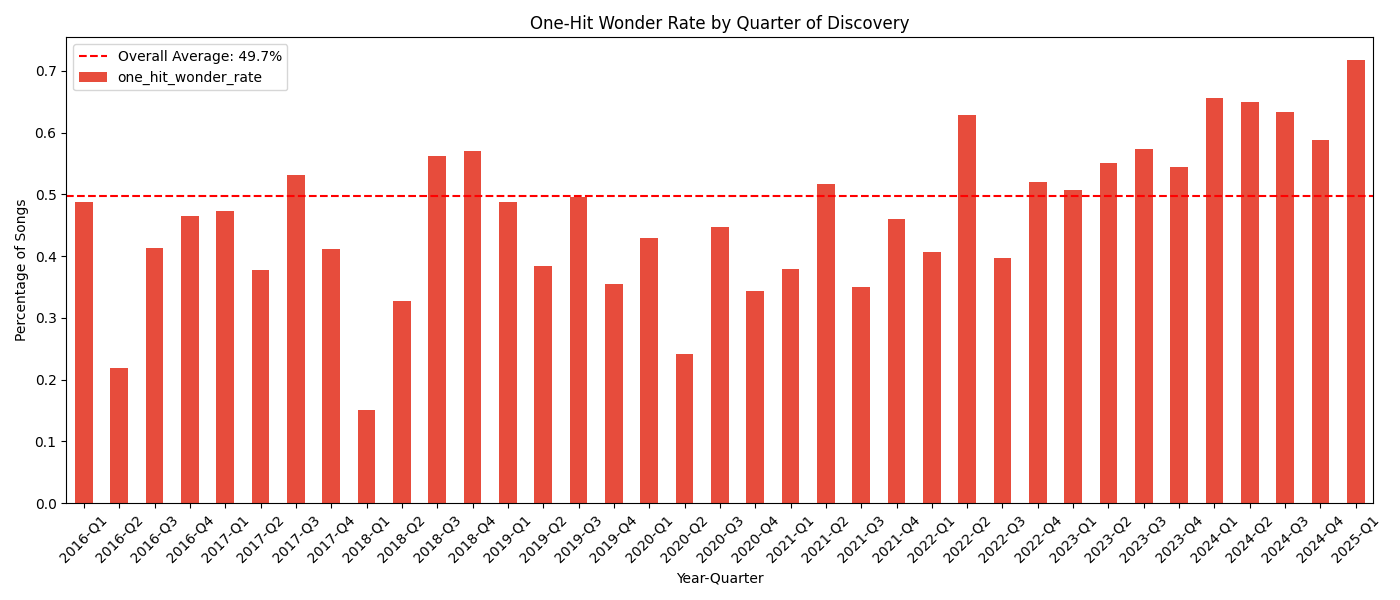
The rate of my likelihood abandoning a song, thereby rendering it what Claude teasingly deemed a ‘one-hit wonder’.

My friends and I spent longer than I care to admit Googling ‘why use a log scale’ to interpret this graph on how long songs stay in my listening rotation. I tried to walk my way through the code that Claude wrote for me, but some of its choices were hard to grok.

Post Malone being on this list is hilarious since I can’t name a single Post Malone song. Then I remembered that sometime in 2016 or 2017, I logged into Spotify on my coworker Megan’s phone when we were running an event at the university. Years later, Megan messaged me: “I’M STILL LOGGED INTO YOUR SPOTIFY!” So perhaps she is also a Post Malone fan?
The limit does not exist
With tools like Claude at my fingertips, the possibilities for surfacing truths are endless. I can’t say that I was shocked by anything, but the patterns unearthed were oddly reassuring. The subtle trends at every level – daily, weekly, seasonally – hinted that there is a method to the messy chaos that is my life.
I turn to music for long roadtrips and sunlit adventures. For wintry days and forced isolations. For weekends at home or away, in good company, probably singing too loudly and out of key. I’m open to newness, and yet return each year to a handful of artists that soothe my stressed out soul.
Uncovering memories to match the moments in data made me appreciate how much change I’ve been through in the last decade. The exercise prompted gratitude for all the people who’ve shared songs that they love, sang along with me, or yelled at me from the back seat to stop pushing the skip button.
I don’t think “minutes listened” is a useful KPI for measuring my worth. But I’m starting to suspect that hard benchmarks are irrelevant. That maybe it’s okay to just sit back, put your feet up, and listen to the music.
Acknowledgements
Many thanks to Antonio and Anneliese for their informative Make Your Own Spotify Wrapped presentation. If you found this post interesting, download Antonio’s Jupyter Notebook and mock data set, or, better yet, download your own data. They did an incredible job laying out the tool in a clear, easy-to-use way.
Thanks also to Kenny and Sagnik for walking me through getting my own programming environment set up and helping me dream up new ways to look at the data. It’s been a long time since my grad school coding days, and I wouldn’t have had the patience to do it without them.
Media that got me thinking about this post
Book: Liz Pelly’s Mood Machine (a detailed deep dive into the history of Spotify)
Podcast: Intelligence Squared - The Rise of Spotify (a podcast interview Liz Pelly)
Essay: How A.I. Generated Music is Siphoning Streams from Artists in Seattle and Beyond
Essay: Marshall McLuhan’s ‘The Medium is the Message’ (excerpt, Understanding Media)
Video: McLuhan interviewed on his essay, ‘The Medium is the Message’